问题定位和性能优化案例集锦 -- 工具补充实验
作为问题定位和性能优化案例集锦的补充,实验并记录工具用法。
1. 背景
限于 问题定位和性能优化案例集锦 的篇幅,其中的一些指标、工具、实验等在本篇中进行记录。
2. 系统指标
2.1. proc smaps:进程的内存段信息
虚拟内存布局,可见之前的梳理:CPU及内存调度(二) – Linux内存管理
1
2
3
4
5
6
7
8
9
10
11
12
13
14
15
16
17
18
19
20
21
22
23
24
25
26
27
28
29
30
31
32
33
34
35
36
37
38
39
40
41
42
43
44
45
46
47
48
49
50
51
52
53
54
55
56
57
58
59
60
61
62
63
64
65
66
67
# smaps内容
[CentOS-root@xdlinux ➜ ~ ]$ cat /proc/$(pidof mysqld)/smaps
# ----------------- 内存段的基本信息 ---------------
# 该内存段的虚拟地址范围,smaps里有很多段范围信息
    # r-xp 是权限标志,表示可读、不可写、可执行、私有(非共享)。查看完整文件结果可看到还有`rw-s`、`r-xp`等等
    # 00000000:偏移量,表示文件映射到内存中的偏移位置
    # fd:00:设备号,fd 是主设备号,00 是次设备号
    # 136301417:inode号,标识文件
    # /usr/libexec/mysqld:内存映射的文件路径
55a5d35ad000-55a5d70ba000 r-xp 00000000 fd:00 136301417                  /usr/libexec/mysqld
# ------------------ 内存大小相关 ---------------
# 内存段的总大小,包括未使用的部分
Size:              60468 kB
# KernelPageSize 和 MMUPageSize,是 内核和硬件 MMU(内存管理单元)支持的页面大小,通常为 4 KB
KernelPageSize:        4 kB
MMUPageSize:           4 kB
# ------------------ RSS 和 PSS 相关 ---------------
# Resident Set Size,常驻物理内存
Rss:               28692 kB
# Proportional Set Size,按比例分配的内存大小。此处和Rss一样,说明没有共享内存
Pss:               28692 kB
# ------------------ 共享和私有内存 ---------------
# 共享的干净(未修改)和脏(已修改)内存大小
Shared_Clean:          0 kB
Shared_Dirty:          0 kB
# 私有的干净和脏内存大小
Private_Clean:     28692 kB
Private_Dirty:         0 kB
# ------------------ 引用和匿名内存 ---------------
# 最近被访问过的内存大小为 28692 KB
Referenced:        28692 kB
# 匿名内存(未映射到文件的内存)大小为 0 KB
Anonymous:             0 kB
# 延迟释放的内存大小为 0 KB
LazyFree:              0 kB
# ------------------ 大页和共享内存相关字段 ---------------
# 匿名大页内存大小
AnonHugePages:         0 kB
# 通过 PMD(Page Middle Directory)映射的`共享内存`大小
# 64位系统,通过`四级页表`(`页全局目录PGD`+`页上级目录PUD`+`页中间目录PMD`+`页表项PTE`),映射 `2^48 = 256TB`的虚拟地址空间
ShmemPmdMapped:        0 kB
# 通过 PMD 映射的`文件内存`大小
FilePmdMapped:         0 kB
# 共享的 HugeTLB(透明大页)内存大小
Shared_Hugetlb:        0 kB
# 私有的 HugeTLB 内存大小
Private_Hugetlb:       0 kB
# ------------------ 交换和锁定内存 ---------------
# 被交换到磁盘的内存量
Swap:                  0 kB
# 按比例分配的交换内存量
SwapPss:               0 kB
# 锁定在物理内存中的内存大小。这些内存页不会被操作系统交换到磁盘,而是始终驻留在物理内存中
Locked:                0 kB
# 内存段是否符合透明大页(Transparent Huge Pages, THP)的条件
THPeligible:    0
# 内存保护密钥(Memory Protection Key)
ProtectionKey:         0
# 该内存段的虚拟内存标志位
    # rd: 可读(Read)。
    # ex: 可执行(Execute)。
    # mr: 可映射读取(May Read)。
    # mw: 可映射写入(May Write)。
    # me: 可映射执行(May Execute)。
    # dw: 脏页可写(Dirty Write)。
    # sd: 交换时丢弃(Swapped Discard)
VmFlags: rd ex mr mw me dw sd
作为对比,/proc/$(pidof mysqld)/maps中的内容就比较少了,只有内存段的基本信息:
1
2
3
4
5
6
7
8
# maps内容
[CentOS-root@xdlinux ➜ ~ ]$ cat /proc/$(pidof mysqld)/maps
55a5d35ad000-55a5d70ba000 r-xp 00000000 fd:00 136301417                  /usr/libexec/mysqld
55a5d70ba000-55a5d722f000 r--p 03b0c000 fd:00 136301417                  /usr/libexec/mysqld
55a5d722f000-55a5d75b6000 rw-p 03c81000 fd:00 136301417                  /usr/libexec/mysqld
...
55a5d7f4e000-55a5da7d0000 rw-p 00000000 00:00 0                          [heap]
...
3. bcc/bpftrace、perf-tools系列工具
3.1. bcc syscount
1
2
3
4
5
6
7
8
9
10
11
12
13
14
15
16
17
18
19
20
21
22
23
[CentOS-root@xdlinux ➜ tools ]$ ./syscount -h
usage: syscount [-h] [-p PID] [-i INTERVAL] [-d DURATION] [-T TOP] [-x]
                [-e ERRNO] [-L] [-m] [-P] [-l]

Summarize syscall counts and latencies.

optional arguments:
  -h, --help            show this help message and exit
  -p PID, --pid PID     trace only this pid
  -i INTERVAL, --interval INTERVAL
                        print summary at this interval (seconds)
  -d DURATION, --duration DURATION
                        total duration of trace, in seconds
  -T TOP, --top TOP     print only the top syscalls by count or latency
  -x, --failures        trace only failed syscalls (return < 0)
  -e ERRNO, --errno ERRNO
                        trace only syscalls that return this error (numeric or
                        EPERM, etc.)
  -L, --latency         collect syscall latency
  -m, --milliseconds    display latency in milliseconds (default:
                        microseconds)
  -P, --process         count by process and not by syscall
  -l, --list            print list of recognized syscalls and exit
1、指定进程,查看耗时高的函数 或者 初步分析后特定函数的耗时变化,比如案例中的mmap耗时长(实践指南:关注问题前后的耗时变化对比)
(下面的perf trace 有类似功能,并可提供 min、avg、max 统计,便于统计长尾延迟)
1
2
3
4
5
6
7
8
9
10
11
12
13
14
15
16
17
18
# -L打印耗时
[CentOS-root@xdlinux ➜ tools ]$ ./syscount -L -p $(pidof redis-server)  -i 1
Tracing syscalls, printing top 10... Ctrl+C to quit.
[22:36:12]
SYSCALL                   COUNT        TIME (us)
epoll_wait                    9       903357.105
openat                       10          165.590
read                         20          128.471
getpid                       10           21.898
close                        10           10.570

[22:36:13]
SYSCALL                   COUNT        TIME (us)
epoll_wait                   10      1003186.186
openat                       10          166.682
read                         20          128.159
getpid                       10           20.359
close                        10            9.638
下面则是 问题定位和性能优化案例集锦 – Redis长尾延迟案例 对应的mmap跟踪,截取贴到下面:
1
2
3
4
5
6
7
8
9
10
11
12
13
14
15
16
17
18
19
20
21
22
23
24
25
26
27
28
$> syscount -L -i 30  -p $PID
[21:39:27]
SYSCALL                   COUNT        TIME (us)
epoll_pwait               24952      4322184.374
write                     34458       331600.262
read                      26400        59001.053
open                         50          527.602
epoll_ctl                    70           93.506
getpid                       50           39.793
close                        50           35.262
munmap                        1           26.372
getpeername                  12           15.252
# 问题发生前mmap耗时 11 us
mmap                          1           11.003

[21:40:14]
SYSCALL                   COUNT        TIME (us)
epoll_pwait               24371      4189948.513
write                     34110       296551.821
# 问题发生时mmap耗时 177 ms
mmap                          1       177477.938
read                      25878        57099.880
open                         48          504.271
epoll_ctl                    68          104.834
getpid                       49           45.939
close                        49           37.919
getpeername                   8           13.127
accept                        2            7.896
2、用syscount统计错误码出现的次数:
1
2
[CentOS-root@xdlinux ➜ ~ ]$ /usr/share/bcc/tools/syscount -e ENOSPC
Tracing syscalls, printing top 10... Ctrl+C to quit.
3、也可根据错误码查看eBPF的程序代码细节:
1
2
3
4
5
6
7
8
9
10
11
12
13
14
15
16
17
18
19
20
21
22
23
24
25
26
27
28
29
30
31
32
# syscount -e ENOSPC 用于统计返回 ENOSPC 错误的系统调用次数
# 添加 --ebpf 参数后,会显示底层的 eBPF 程序代码,而不是直接运行统计功能
[CentOS-root@xdlinux ➜ ~ ]$ /usr/share/bcc/tools/syscount -e ENOSPC --ebpf
#define FILTER_ERRNO 28

#ifdef LATENCY
struct data_t {
    u64 count;
    u64 total_ns;
};

BPF_HASH(start, u64, u64);
BPF_HASH(data, u32, struct data_t);
#else
BPF_HASH(data, u32, u64);
#endif

#ifdef LATENCY
TRACEPOINT_PROBE(raw_syscalls, sys_enter) {
    u64 pid_tgid = bpf_get_current_pid_tgid();

#ifdef FILTER_PID
    if (pid_tgid >> 32 != FILTER_PID)
        return 0;
#endif

    u64 t = bpf_ktime_get_ns();
    start.update(&pid_tgid, &t);
    return 0;
}
#endif
    ...
3.2. funcslower 跟踪用户空间接口耗时
bcc 和 perf-tools 中都有
funcslower,但是 bcc 中的功能更丰富一些。
3.2.1. bcc和perf-tools中的 funcslower 说明
1、perf-tools 中的 funcslower:只能追踪内核函数,没有用户程序的函数
1
2
3
4
5
6
7
8
9
10
11
12
13
[CentOS-root@xdlinux ➜ tools git:(main) ]$ perf-tools/bin/funcslower -h
USAGE: funcslower [-aChHPt] [-p PID] [-L TID] [-d secs] funcstring latency_us
                 -a              # all info (same as -HPt)
                 -C              # measure on-CPU time only
                 -d seconds      # trace duration, and use buffers
                 -h              # this usage message
                 -H              # include column headers
                 -p PID          # trace when this pid is on-CPU
                 -L TID          # trace when this thread is on-CPU
                 -P              # show process names & PIDs
                 -t              # show timestamps
  eg,
       funcslower vfs_read 10000 # trace vfs_read() slower than 10 ms
追踪的信息比较简单:
1
2
3
4
5
6
7
8
9
10
11
12
[CentOS-root@xdlinux ➜ bin git:(master) ✗ ]$ ./funcslower vfs_write 10 -a
Tracing "vfs_write" slower than 10 us... Ctrl-C to end.
  8) + 28.774 us   |  } /* vfs_write */
  6) + 39.595 us   |  } /* vfs_write */
 13) + 12.122 us   |  } /* vfs_write */
  6) + 19.035 us   |  } /* vfs_write */
 13) + 10.009 us   |  } /* vfs_write */
  6) + 20.338 us   |  } /* vfs_write */
  6) + 12.894 us   |  } /* vfs_write */
  8) + 12.854 us   |  } /* vfs_write */
 13) + 16.992 us   |  } /* vfs_write */
  6) + 53.711 us   |  } /* vfs_write */
2、bcc中的 funcslower:
1
2
3
4
5
6
7
8
9
10
11
12
13
14
15
16
17
18
19
20
21
22
23
24
25
26
27
28
29
30
31
32
33
34
35
36
[CentOS-root@xdlinux ➜ tools git:(main) ]$ /usr/share/bcc/tools/funcslower -h
usage: funcslower [-h] [-p PID] [-m MIN_MS] [-u MIN_US] [-a ARGUMENTS] [-T]
                  [-t] [-v] [-f] [-U] [-K]
                  function [function ...]

Trace slow kernel or user function calls.

positional arguments:
  function              function(s) to trace

optional arguments:
  -h, --help            show this help message and exit
  -p PID, --pid PID     trace this PID only
  -m MIN_MS, --min-ms MIN_MS
                        minimum duration to trace (ms)
  -u MIN_US, --min-us MIN_US
                        minimum duration to trace (us)
  -a ARGUMENTS, --arguments ARGUMENTS
                        print this many entry arguments, as hex
  -T, --time            show HH:MM:SS timestamp
  -t, --timestamp       show timestamp in seconds at us resolution
  -v, --verbose         print the BPF program for debugging purposes
  -f, --folded          output folded format, one line per stack (for flame
                        graphs)
  -U, --user-stack      output user stack trace
  -K, --kernel-stack    output kernel stack trace

examples:
  ./funcslower vfs_write        # trace vfs_write calls slower than 1ms
  ./funcslower -m 10 vfs_write  # same, but slower than 10ms
  ./funcslower -u 10 c:open     # trace open calls slower than 10us
  ./funcslower -p 135 c:open    # trace pid 135 only
  ./funcslower c:malloc c:free  # trace both malloc and free slower than 1ms
  ./funcslower -a 2 c:open      # show first two arguments to open
  ./funcslower -UK -m 10 c:open # Show user and kernel stack frame of open calls slower than 10ms
  ./funcslower -f -UK c:open    # Output in folded format for flame graphs
3.2.2. bcc funcslower使用实验
funcslower 可以跟踪用户空间接口,包括glibc库和应用程序。也可以跟踪内核函数。
比如下面追踪Redis中的事件循环处理函数,通过redis-cli连接后追踪到下述函数调用:
1
2
3
4
5
6
7
8
9
10
# `-UK`:用户空间和内核空间均输出;
# `-u 300`:追踪比 300 us更慢的函数;
# `-p` 追踪指定进程
# '/usr/bin/redis-server:processCommand':追踪应用程序的函数,格式是:`应用程序:函数名`(上面的不使用`-p`指定进程也可以使用此处追踪)
[CentOS-root@xdlinux ➜ ~ ]$ /usr/share/bcc/tools/funcslower -UK -u 300 -p $(pidof redis-server) '/usr/bin/redis-server:processCommand'
Tracing function calls slower than 300 us... Ctrl+C to quit.
COMM           PID    LAT(us)             RVAL FUNC
redis-server   1206    376.53                0 /usr/bin/redis-server:processCommand
    b'processInputBuffer'
    b'[unknown]'
上面是yum安装的Redis服务,为了避免符号丢失的影响。这里也使用自己编译的redis-server启动下,并追踪对应的bin。
不过貌似也没更多的堆栈。
1
2
3
4
5
6
7
[CentOS-root@xdlinux ➜ src git:(6.0) ✗ ]$ /usr/share/bcc/tools/funcslower -UK -u 1 '/home/workspace/redis/src/redis-server:processCommand'
Tracing function calls slower than 1 us... Ctrl+C to quit.
COMM           PID    LAT(us)             RVAL FUNC
redis-server   71546   592.09                0 /home/workspace/redis/src/redis-server:processCommand
    b'processCommandAndResetClient'
redis-server   71546    15.20                0 /home/workspace/redis/src/redis-server:processCommand
    b'processCommandAndResetClient'
追踪内核函数vfs_write的示例:
1
2
3
4
5
6
7
8
9
10
[CentOS-root@xdlinux ➜ src git:(6.0) ✗ ]$ /usr/share/bcc/tools/funcslower vfs_write -u 10 -KU
Tracing function calls slower than 10 us... Ctrl+C to quit.
COMM           PID    LAT(us)             RVAL FUNC
sshd           70712    29.73               1c vfs_write
    b'kretprobe_trampoline'
    b'__libc_write'
funcslower     71980    22.70               3a vfs_write
    b'kretprobe_trampoline'
    b'__write'
...
3.3. funcgraph (perf-tools工具)
funcgraph 工具之前用过很多次了,追踪内核态的接口调用栈很方便,这里特别再提一下。只是在perf-tools中,bcc里没有。
比如下文中的使用示例:
Linux存储IO栈梳理(二) – Linux内核存储栈流程和接口
4. perf
4.1. perf trace
bcc的 syscount(上面有小节说明) 也提供系统调用的耗时统计情况。
不过此处perf trace统计效果更好,提供了histogram分布图,可以直观的发现长尾问题。
1
2
3
4
5
6
7
8
9
10
11
12
13
14
15
16
# -s, --summary
# 其他参数:-S 实时打印当前的syscall系统调用;-C 指定特定cpu进行追踪;
[CentOS-root@xdlinux ➜ tools ]$ perf trace -p $(pidof redis-server) -s
^C
 Summary of events:

 redis-server (1206), 922 events, 100.0%

   syscall            calls  errors  total       min       avg       max       stddev
                                     (msec)    (msec)    (msec)    (msec)        (%)
   --------------- --------  ------ -------- --------- --------- ---------     ------
   epoll_wait            77      0  7624.287     0.000    99.017   100.533      1.32%
   openat                77      0     1.561     0.015     0.020     0.033      3.04%
   read                 154     77     1.470     0.003     0.010     0.048      5.61%
   close                 77      0     0.157     0.001     0.002     0.003      2.14%
   getpid                77      0     0.155     0.001     0.002     0.003      1.91%
下面则是 问题定位和性能优化案例集锦 – Redis长尾延迟案例 对应的mmap跟踪,没记录问题发生时的情况,仅贴一个普通情形下的追踪:
1
2
3
4
5
6
7
8
9
10
11
12
13
14
15
16
17
18
19
20
21
perf trace -p $PID -s

   syscall            calls    total       min       avg       max      stddev
                               (msec)    (msec)    (msec)    (msec)        (%)
   --------------- -------- --------- --------- --------- ---------     ------
   epoll_pwait        53841 14561.545     0.000     0.270     4.538      0.53%
   write              56177   757.799     0.005     0.013     0.047      0.09%
   read               55591   219.250     0.001     0.004     0.702      0.67%
   open                 170     2.468     0.012     0.015     0.043      1.69%
   getpid               171     1.668     0.002     0.010     1.069     63.91%
   # 非问题现场
   mmap                  76     0.795     0.007     0.010     0.018      2.14%
   munmap                77     0.643     0.003     0.008     0.030      7.91%
   epoll_ctl            151     0.533     0.001     0.004     0.014      4.26%
   close                173     0.291     0.001     0.002     0.012      3.87%
   getpeername           24     0.064     0.002     0.003     0.004      4.76%
   accept                 8     0.045     0.003     0.006     0.011     18.34%
   setsockopt            20     0.040     0.001     0.002     0.003      5.50%
   fcntl                 16     0.029     0.001     0.002     0.006     15.83%
   getrusage              3     0.008     0.001     0.003     0.006     48.77%
   getcwd                 1     0.006     0.006     0.006     0.006      0.00%
4.2. perf sched 跟踪调度
跟着 Brendan Gregg 大佬的文章实验:perf sched for Linux CPU scheduler analysis
1
2
3
4
# 需要先record
perf sched record -- sleep 10
# 再 perf script --header、perf sched latency、perf sched map、perf sched timehist 等操作,都要依赖上面的数据
perf sched timehist
1
2
3
4
5
6
7
8
9
# 查看sched相关tracepoint
# 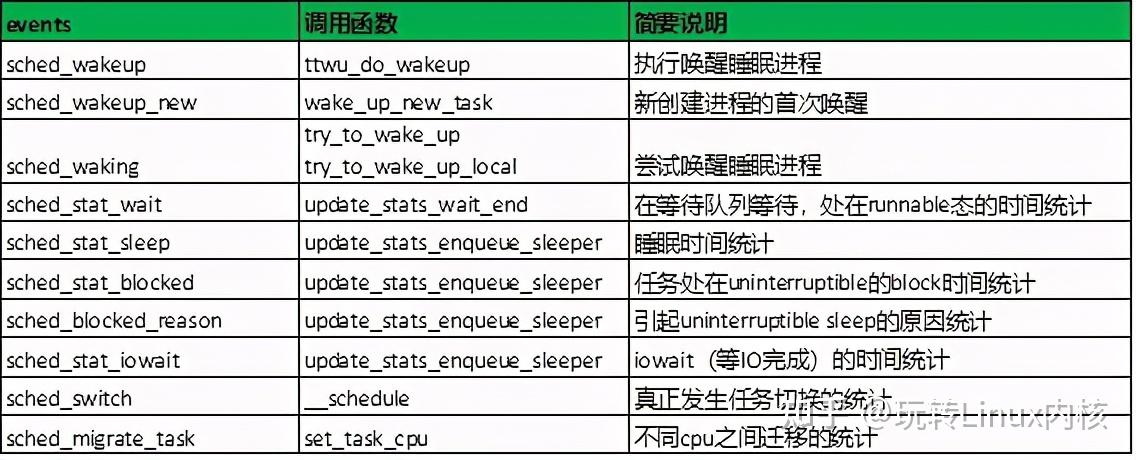
[CentOS-root@xdlinux ➜ ~ ]$ bpftrace -l 'tracepoint:sched:*'
tracepoint:sched:sched_kthread_stop
# perf也可查看,模糊匹配
[CentOS-root@xdlinux ➜ ~ ]$ perf list sched
sched:sched_swap_numa [Tracepoint event]
sched:sched_switch [Tracepoint event]
sched:sched_wait_task [Tracepoint event]
perf sched实践策略:record采集,latency查看延时分布找到可疑位置,script分析对应时间点的具体调度事件
1
2
3
4
5
6
7
8
9
10
11
12
13
14
15
16
17
18
19
20
21
22
23
24
25
26
27
28
29
30
31
32
33
34
35
36
37
38
39
40
41
42
43
44
45
46
47
# perf sched record 采集
[CentOS-root@xdlinux ➜ ~ ]$ perf sched record sleep 5
[ perf record: Woken up 1 times to write data ]
[ perf record: Captured and wrote 0.485 MB perf.data (2267 samples) ]

# perf sched latency 分析延时
[CentOS-root@xdlinux ➜ ~ ]$ perf sched latency
---------------------------------------------------------------------------------------------------------------------------------
  Task        |   Runtime ms  | Switches | Avg delay ms    | Max delay ms    | Max delay start           | Max delay end          |
 --------------------------------------------------------------------------------------------------------------------------------
  mysqld:(24)        |  6.093 ms |   24  | avg:   0.000 ms | max:   0.000 ms | max start:     0.000000 s | max end:     0.000000 s
  tuned:(3)          |  2.057 ms |    3  | avg:   0.000 ms | max:   0.000 ms | max start:     0.000000 s | max end:     0.000000 s
  perf:(2)           |  1.655 ms |    1  | avg:   0.000 ms | max:   0.000 ms | max start:     0.000000 s | max end:     0.000000 s
  sleep:35479        |  0.952 ms |    1  | avg:   0.000 ms | max:   0.000 ms | max start:     0.000000 s | max end:     0.000000 s
  irqbalance:1117    |  0.465 ms |    1  | avg:   0.000 ms | max:   0.000 ms | max start:     0.000000 s | max end:     0.000000 s
  in:imjournal:1763  |  0.194 ms |    1  | avg:   0.000 ms | max:   0.000 ms | max start:     0.000000 s | max end:     0.000000 s
  NetworkManager:1200|  0.138 ms |    1  | avg:   0.000 ms | max:   0.000 ms | max start:     0.000000 s | max end:     0.000000 s

# perf script、 perf sched script 都可以分析具体d的原始事件,分析sched调度切换
[CentOS-root@xdlinux ➜ ~ ]$ perf script
    perf 35478 [000] 605084.480470: sched:sched_stat_runtime: comm=perf pid=35478 runtime=48942 [ns] vruntime=436496118956 [ns]
    perf 35478 [000] 605084.480473:       sched:sched_waking: comm=migration/0 pid=12 prio=0 target_cpu=000
    perf 35478 [000] 605084.480474: sched:sched_stat_runtime: comm=perf pid=35478 runtime=5360 [ns] vruntime=436496124316 [ns]
    perf 35478 [000] 605084.480475:       sched:sched_switch: prev_comm=perf prev_pid=35478 prev_prio=120 prev_state=R+ ==> next_comm=migration/0 next_pid=12 next_prio=0
migration/0    12 [000] 605084.480477: sched:sched_migrate_task: comm=perf pid=35478 prio=120 orig_cpu=0 dest_cpu=1
migration/0    12 [000] 605084.480483:       sched:sched_switch: prev_comm=migration/0 prev_pid=12 prev_prio=0 prev_state=D ==> next_comm=swapper/0 next_pid=0 next_prio=120

# perf sched map 分析cpu情况,星号表示调度事件发生所在的 CPU,点号表示该 CPU 正在 IDLE
[CentOS-root@xdlinux ➜ ~ ]$ perf sched map
  *A0                                                      605084.480475 secs A0 => migration/0:12
  *.                                                       605084.480483 secs .  => swapper:0
   .  *B0                                                  605084.480555 secs B0 => migration/1:17
   .  *.                                                   605084.480561 secs
   .   .  *C0                                              605084.480684 secs C0 => migration/2:23
   .   .  *.                                               605084.480693 secs

# perf sched timehist
[CentOS-root@xdlinux ➜ ~ ]$ perf sched timehist
          time    cpu  task name                       wait time  sch delay   run time
                        [tid/pid]                          (msec)     (msec)     (msec)
--------------- ------  ------------------------------  ---------  ---------  ---------
  605084.480473 [0000]  perf[35478]                                                      awakened: migration/0[12]
  605084.480475 [0000]  perf[35478]                         0.000      0.000      0.000
  605084.480477 [0000]  migration/0[12]                                                  migrated: perf[35478] cpu 0 => 1
  605084.480483 [0000]  migration/0[12]                     0.000      0.001      0.007
  605084.480553 [0001]  perf[35478]                                                      awakened: migration/1[17]
  605084.480555 [0001]  perf[35478]                         0.000      0.000      0.000
下面是 问题定位和性能优化案例集锦 – 进程调度案例 中抓取的调度延迟情况:
1
2
3
4
5
6
7
8
9
10
11
12
13
$ perf sched latency
...
  :211677:211677        |    160.391 ms |     2276 | avg:    2.231 ms | max:  630.267 ms | max at: 1802765.259076 s
  :211670:211670        |    137.200 ms |     2018 | avg:    2.356 ms | max:  591.592 ms | max at: 1802765.270541 s
...

$ perf sched script
# 结果截取
# tid 114把tid 115唤醒了(在075核上),但过了500+ms后,009核上的tid 112运行完才再次调度tid 115。
# 这意味着009核出于某些原因一直不运行tid 115
rpchandler   114 [011] 1802764.628809:       sched:sched_wakeup: rpchandler:211677 [120] success=1 CPU:075
rpchandler   112 [009] 1802765.259076:       sched:sched_switch: rpchandler:211674 [120] T ==> rpchandler:211677 [120]
rpchandler   115 [009] 1802765.259087: sched:sched_stat_runtime: comm=rpchandler pid=211677 runtime=12753 [ns] vruntime=136438477015677 [ns]
再往前看看009这个核在干嘛,发现一直在调度时间轮线程:
1
2
3
4
5
6
7
8
9
10
11
12
 TimeWheel.Routi    43 [009] 1802765.162014: sched:sched_stat_runtime: comm=TimeWheel.Routi pid=210771 runtime=2655 [ns] vruntime=136438438256234 [ns]
 TimeWheel.Routi    43 [009] 1802765.162015:       sched:sched_switch: TimeWheel.Routi:210771 [120] D ==> swapper/9:0 [120]
         swapper     0 [009] 1802765.163067:       sched:sched_wakeup: TimeWheel.Routi:210771 [120] success=1 CPU:009
         swapper     0 [009] 1802765.163069:       sched:sched_switch: swapper/9:0 [120] S ==> TimeWheel.Routi:210771 [120]
 TimeWheel.Routi    43 [009] 1802765.163073: sched:sched_stat_runtime: comm=TimeWheel.Routi pid=210771 runtime=4047 [ns] vruntime=136438438260281 [ns]
 TimeWheel.Routi    43 [009] 1802765.163074:       sched:sched_switch: TimeWheel.Routi:210771 [120] D ==> swapper/9:0 [120]
         swapper     0 [009] 1802765.164129:       sched:sched_wakeup: TimeWheel.Routi:210771 [120] success=1 CPU:009
         swapper     0 [009] 1802765.164131:       sched:sched_switch: swapper/9:0 [120] S ==> TimeWheel.Routi:210771 [120]
 TimeWheel.Routi    43 [009] 1802765.164135: sched:sched_stat_runtime: comm=TimeWheel.Routi pid=210771 runtime=3616 [ns] vruntime=136438438263897 [ns]
 TimeWheel.Routi    43 [009] 1802765.164137:       sched:sched_switch: TimeWheel.Routi:210771 [120] D ==> swapper/9:0 [120]
         swapper     0 [009] 1802765.165187:       sched:sched_wakeup: TimeWheel.Routi:210771 [120] success=1 CPU:009
         swapper     0 [009] 1802765.165189:       sched:sched_switch: swapper/9:0 [120] S ==> TimeWheel.Routi:210771 [120]
5. nettrace
腾讯开源的:nettrace,基于eBPF追踪网络包很方便,可以追踪netfilter对应的四表五链过程、丢包原因、运行在哪个CPU等。
功能比较全面,而且兼容了一些低版本内核。另外也使用了一下cilium的 pwru,但感觉启动和停止的速度有点慢,自己用nettrace体验性更好点。
1
2
3
4
5
6
7
8
9
10
11
12
13
14
15
16
[CentOS-root@xdlinux ➜ nettrace-1.2.11-1.tl3.x86_64 ]$ ./nettrace -h
nettrace: a tool to trace skb in kernel and diagnose network problem

Usage:
    -s, --saddr      filter source ip/ipv6 address
    -d, --daddr      filter dest ip/ipv6 address
    --addr           filter source or dest ip/ipv6 address
    -S, --sport      filter source TCP/UDP port
    -D, --dport      filter dest TCP/UDP port
    -P, --port       filter source or dest TCP/UDP port
    -p, --proto      filter L3/L4 protocol, such as 'tcp', 'arp'
    ...
    --diag           enable 'diagnose' mode
    ...
    --drop           skb drop monitor mode, for replace of 'droptrace'
    ...
示例:
1
2
3
4
5
6
7
8
9
10
11
12
13
14
15
16
[CentOS-root@xdlinux ➜ nettrace-1.2.11-1.tl3.x86_64 ]$ ./nettrace -ptcp -P8000
WARN: DEBUG_INFO_BTF_MODULES not enabled, some infomation, such as nf_tables, maybe incorrect
begin trace...
***************** c0103f00 ***************
[297786.410474] [napi_gro_receive_entry] TCP: 192.168.1.4:61952 -> 192.168.1.150:8000 seq:3349256003, ack:0, flags:S
[297786.410499] [dev_gro_receive     ] TCP: 192.168.1.4:61952 -> 192.168.1.150:8000 seq:3349256003, ack:0, flags:S
...
[297786.410522] [nf_hook_slow        ] TCP: 192.168.1.4:61952 -> 192.168.1.150:8000 seq:3349256003, ack:0, flags:S *ipv4 in chain: PRE_ROUTING*
[297786.410528] [nft_do_chain        ] TCP: 192.168.1.4:61952 -> 192.168.1.150:8000 seq:3349256003, ack:0, flags:S *iptables table:, chain:PREROUT*
...
[297786.410617] [ip_local_deliver    ] TCP: 192.168.1.4:61952 -> 192.168.1.150:8000 seq:3349256003, ack:0, flags:S
[297786.410619] [nf_hook_slow        ] TCP: 192.168.1.4:61952 -> 192.168.1.150:8000 seq:3349256003, ack:0, flags:S *ipv4 in chain: INPUT*
...
[297786.410690] [tcp_v4_do_rcv       ] TCP: 192.168.1.4:61952 -> 192.168.1.150:8000 seq:3349256003, ack:0, flags:S
[297786.410699] [tcp_rcv_state_process] TCP: 192.168.1.4:61952 -> 192.168.1.150:8000 seq:3349256003, ack:0, flags:S *TCP socket state has changed*
[297786.410897] [consume_skb         ] TCP: 192.168.1.4:61952 -> 192.168.1.150:8000 seq:3349256003, ack:0, flags:S *packet is freed (normally)*
丢包追踪:
1
2
3
4
5
6
7
8
9
# --drop --drop-stack 只追踪丢包,同时打印堆栈
[297732.940939] TCP: 192.168.1.4:61946 -> 192.168.1.150:8000 seq:3697503931, ack:2330213106, flags:AF *tcp_v4_rcv+0x48* *packet is dropped by kernel*
Call Stack:
    -> kfree_skb+0x73
    -> kfree_skb+0x73
    -> tcp_v4_rcv+0x48
    ...
    -> start_secondary+0x19b
    -> secondary_startup_64_no_verify+0xc2
发包进程详情:
1
2
# --detail 则可打印发包进程对应的 CPU、网卡、进程号
[297286.084747] [c0103f00][napi_gro_receive_entry][cpu:9  ][enp4s0][pid:0      ][swapper/9   ][ns:0] TCP: 192.168.1.4:61864 -> 192.168.1.150:8000 seq:1364142653, ack:0, flags:S
函数栈间时延:
1
2
# --latency 则可打印函数间的调用时延
[297488.582244] [consume_skb         ][napi_gro_receive_entry -> tcp_rcv_state_process] TCP: 192.168.1.4:61896 -> 192.168.1.150:8000 seq:3769012161, ack:0, flags:S latency: 0.123ms
另外发现一个博主梳理nettrace源码的系列文章也可以看看:Nettrace工具学习记录之流程梳理。这篇和其他文章里画的图风格也挺棒的,可以参考。(最近看东西发现CSDN上不少高质量博主和文章,安装个油猴插件屏蔽糟糕的各种网站弹窗和提示)
6. kdump 和 crash
1、kdump:
1
2
3
4
5
6
7
8
9
10
11
# 触发系统panic:
[CentOS-root@xdlinux ➜ ~ ]$ echo c > /proc/sysrq-trigger
# 查看dump文件
[CentOS-root@xdlinux ➜ ~ ]$ ll /var/crash
drwxr-xr-x 2 root root 67 Mar 30 10:29 127.0.0.1-2025-03-30-10:29:58
[CentOS-root@xdlinux ➜ ~ ]$ ll /var/crash/127.0.0.1-2025-03-30-10:29:58
# 上次内核的dmesg信息
-rw------- 1 root root  98K Mar 30 10:29 kexec-dmesg.log
-rw------- 1 root root 295M Mar 30 10:29 vmcore
# 崩溃时的dmesg信息
-rw------- 1 root root  80K Mar 30 10:29 vmcore-dmesg.txt
2、crash:用于分析系统coredump文件
分析dump文件需要内核vmlinux,安装对应内核的dbgsym包(没有则手动下载rmp安装:http://debuginfo.centos.org)
内核调试符号包:kernel-debuginfo、kernel-debuginfo-common。可以到阿里云的镜像站(比如 centos-debuginfo)下载对应内核版本,比较快。
rpm -ivh手动安装,会安装到:/usr/lib/debug/lib/modules
分析方法:
1、加载:
1
2
3
4
5
6
7
8
9
10
11
12
13
14
15
[CentOS-root@xdlinux ➜ download ]$ crash /var/crash/127.0.0.1-2025-03-30-10\:29\:58/vmcore /usr/lib/debug/lib/modules/`uname -r`/vmlinux

crash 7.3.0-2.el8
...
This GDB was configured as "x86_64-unknown-linux-gnu"...

WARNING: kernel relocated [324MB]: patching 103007 gdb minimal_symbol values

      KERNEL: /usr/lib/debug/lib/modules/4.18.0-348.7.1.el8_5.x86_64/vmlinux
    DUMPFILE: /var/crash/127.0.0.1-2025-03-30-10:29:58/vmcore  [PARTIAL DUMP]
        CPUS: 16
        DATE: Sun Mar 30 10:29:39 CST 2025
     ...

crash>
2、常用命令:ps、bt、log
1
2
3
4
5
6
7
8
9
10
11
12
13
14
15
16
17
18
19
20
21
22
23
24
25
26
27
28
29
30
31
32
33
34
35
36
37
38
39
40
41
crash> ps
   PID    PPID  CPU       TASK        ST  %MEM     VSZ    RSS  COMM
>     0      0   0  ffffffff96a18840  RU   0.0       0      0  [swapper/0]
>     0      0   1  ffff9a2403880000  RU   0.0       0      0  [swapper/1]
      0      0   2  ffff9a2403884800  RU   0.0       0      0  [swapper/2]
...

crash> bt
PID: 35261  TASK: ffff9a25a9511800  CPU: 2   COMMAND: "zsh"
 #0 [ffffb694057a3b98] machine_kexec at ffffffff954641ce
 #1 [ffffb694057a3bf0] __crash_kexec at ffffffff9559e67d
 #2 [ffffb694057a3cb8] crash_kexec at ffffffff9559f56d
 #3 [ffffb694057a3cd0] oops_end at ffffffff9542613d
 #4 [ffffb694057a3cf0] no_context at ffffffff9547562f
 #5 [ffffb694057a3d48] __bad_area_nosemaphore at ffffffff9547598c
 #6 [ffffb694057a3d90] do_page_fault at ffffffff95476267
 #7 [ffffb694057a3dc0] page_fault at ffffffff95e0111e
    [exception RIP: sysrq_handle_crash+18]
    RIP: ffffffff959affd2  RSP: ffffb694057a3e78  RFLAGS: 00010246
...

crash> log
[    0.000000] Linux version 4.18.0-348.7.1.el8_5.x86_64 (mockbuild@kbuilder.bsys.centos.org) (gcc version 8.5.0 20210514 (Red Hat 8.5.0-4) (GCC)) #1 SMP Wed Dec 22 13:25:12 UTC 2021
[    0.000000] Command line: BOOT_IMAGE=(hd0,gpt6)/vmlinuz-4.18.0-348.7.1.el8_5.x86_64 root=/dev/mapper/cl_desktop--mme7h3a-root ro crashkernel=auto resume=/dev/mapper/cl_desktop--mme7h3a-swap rd.lvm.lv=cl_desktop-mme7h3a/root rd.lvm.lv=cl_desktop-mme7h3a/swap rhgb quiet
[    0.000000] x86/fpu: Supporting XSAVE feature 0x001: 'x87 floating point registers'

crash> kmem -i
                 PAGES        TOTAL      PERCENTAGE
    TOTAL MEM  8013423      30.6 GB         ----
         FREE  7215135      27.5 GB   90% of TOTAL MEM
         USED   798288         3 GB    9% of TOTAL MEM
       SHARED    32189     125.7 MB    0% of TOTAL MEM
      BUFFERS      915       3.6 MB    0% of TOTAL MEM
       CACHED   481884       1.8 GB    6% of TOTAL MEM
         SLAB    27734     108.3 MB    0% of TOTAL MEM

   TOTAL HUGE        0            0         ----
    HUGE FREE        0            0    0% of TOTAL HUGE

   TOTAL SWAP   262143      1024 MB         ----
    SWAP USED        0            0    0% of TOTAL SWAP