并发与异步编程(四) -- 异步demo实验并分析性能
异步编程实验,使用 gperftools 和 火焰图 进行性能分析。本篇开始进行实验。
异步编程实验,使用 gperftools 和 火焰图 进行性能分析。本篇开始进行实验。
1. 背景
并发与异步编程(二) – 异步编程框架了解 介绍了几种异步编程框架,现在来完成 并发与异步编程(一) – 实现一个简单线程池 中的TODO,进行异步编程实验,并简单进行分析性能。
本篇进行代码实践,并使用 并发与异步编程(三) – 性能分析工具:gperftools和火焰图 中提及的工具进行分析。
2. 采集方法说明
2.1. 采集命令说明
1、gperftools采集及结果转换为pdf说明:
1
2
3
4
5
6
# Makefile中需要 -lprofiler,使用gperftools
g++ thread_pool_withwait.cpp -pthread -g -lprofiler
# 采集结果
CPUPROFILE=./prof.out ./thread_pool_withwait
# 采集信息转换为pdf进行分析
pprof --pdf ./thread_pool_withwait prof.out > prof.pdf
2、采集各种火焰图,新增一个pro_commond.sh脚本手动在不同终端启动,形式如下,完整脚本见:pro_commond.sh
1
2
3
4
5
6
7
8
9
10
11
[CentOS-root@xdlinux ➜ base git:(main) ✗ ]$ ./pro_commond.sh -h
用法: ./pro_commond.sh [选项]
选项:
  -h, --help                        显示此帮助信息
  -r, --run-program                 启动程序并等待回车
  -s, --run-perf-stat               执行 perf stat 并保存结果
  -c, --run-perf-record-and-flame   执行 perf record 并生成常规火焰图
  -w, --generate-wakeup-flamegraphs 生成 wakeup 火焰图
  -o, --generate-offwaketime-flamegraph 生成 offwaketime 火焰图
  -g, --generate-gperftools-report  生成 gperftools 报告
  -x, --clean-results               清理所有结果目录
比如其中的-w选项功能:
1
2
3
4
5
6
7
8
9
10
11
12
13
14
15
function generate_wakeup_flamegraphs() {
    WAKEUP_DIR="wakeup_flamegraph"
    mkdir -p $WAKEUP_DIR
    PID=$(pidof thread_pool_withwait)
    if [ -z "$PID" ]; then
        echo "未找到 thread_pool_withwait 进程"
        return
    fi
    echo "生成 wakeup 火焰图...(程序执行完成后打断采集,会自动生成)"
    /usr/share/bcc/tools/wakeuptime -f -p$PID -f > $WAKEUP_DIR/out.stacks
    cd $WAKEUP_DIR
    flamegraph.pl --color=wakeup --title="Wakeup Time Flame Graph" --countname=us < out.stacks > wakeup.svg
    flamegraph.pl --color=wakeup --title="Wakeup Time Flame Graph" --countname=us --reverse --inverted < out.stacks > wakeup_icicle.svg
    cd..
}
2.2. 采集脚本用法
手动多窗口执行命令(后续考虑脚本中自动起多终端,比如用tmux起不同session):
1
2
3
4
5
6
7
8
9
10
11
12
13
# 终端1 启动运行,等待输入触发(等下面各个终端都启动后,回车触发)
./pro_commond.sh -r
# 终端2 perf stat -p进程
./pro_commond.sh -s
# 终端3 普通on-cpu火焰图,perf record -p进程
./pro_commond.sh -c
# 终端4 wakeup火焰图,需要手动打断(因为wakeuptime -f -p追踪没定时)
./pro_commond.sh -w
# 终端5 offwaketime火焰图,需要手动打断(因为offwaketime -f -p追踪没定时)
./pro_commond.sh -o

# 终端1,最后手动生成gperftools的pdf报告
./pro_commond.sh -g
3. 基准程序
3.1. 基准程序说明
使用第一篇中的线程池程序,进行信息采集作为对比。
为了便于采集工具指定进程,在之前线程池的基础上加上信号触发或等待输入(此处简单处理),启动进程后再开始逻辑
1
2
3
4
5
6
7
8
9
10
11
12
13
14
15
16
17
18
19
20
21
22
23
24
25
26
27
28
29
30
31
32
int main(int argc, char *argv[]) {
    ThreadPool pool(4);
    std::vector<int> data(10000000, 2);
    size_t chunk = data.size() / 8;
    Result result;

    // 等待信号触发
    cout << "Press any key to start the tasks..." << endl;
    cin.get();

    // 信号触发后开始逻辑
    result.task_count = data.size() / chunk + ((data.size() % chunk == 0) ? 0 : 1);
    for (auto i = 0; i < data.size(); i += chunk) {
        int end = std::min(i + chunk, data.size());
        pool.enqueue_task([=, &result]() { task_run(data, i, end, result); });
    }

    // 启动线程池
    pool.start();

    // 等待所有任务完成
    {
        unique_lock<mutex> lock(result.mtx);
        result.cond.wait(lock);
        cout << "result: " << result.sum << endl;
    }

    // 停止线程池
    pool.stop();

    return 0;
}
完整程序见:GitHub链接 里的thread_pool_withwait.cpp
3.2. 运行并采集结果
如上面“采集脚本用法”所述,启动程序和采集。
结果:
1
2
3
4
5
6
7
8
9
10
11
12
13
14
15
16
17
18
19
20
21
22
[CentOS-root@xdlinux ➜ base git:(main) ]$ tree
.
├── Makefile
├── pro_commond.sh
├── results
│   ├── gperftools_report
│   │   ├── prof.out
│   │   └── prof.pdf
│   ├── offwaketime_flamegraph
│   │   ├── offwaketime_out.svg
│   │   └── out.stacks
│   ├── perf_stat_result
│   │   └── perf_stat.out
│   ├── regular_flamegraph
│   │   ├── on_cpu_icicle.svg
│   │   ├── on_cpu.svg
│   │   └── perf.data
│   └── wakeup_flamegraph
│       ├── out.stacks
│       ├── wakeup_icicle.svg
│       └── wakeup.svg
└── thread_pool_withwait.cpp
下面对各部分结果做简要分析。结果相关文件可见:base/results
3.2.1. perf stat结果
1
2
3
4
5
6
7
8
9
10
11
12
13
14
15
 Performance counter stats for process id '69525':

             63.77 msec task-clock                #    0.009 CPUs utilized
                22      context-switches          #    0.345 K/sec
                 0      cpu-migrations            #    0.000 K/sec
             4,575      page-faults               #    0.072 M/sec
       290,443,472      cycles                    #    4.554 GHz                      (66.25%)
           823,375      stalled-cycles-frontend   #    0.28% frontend cycles idle     (70.28%)
         2,921,689      stalled-cycles-backend    #    1.01% backend cycles idle      (70.32%)
       284,414,120      instructions              #    0.98  insn per cycle
                                                  #    0.01  stalled cycles per insn  (69.11%)
        51,552,148      branches                  #  808.389 M/sec                    (75.02%)
            56,986      branch-misses             #    0.11% of all branches          (78.60%)

       7.009230002 seconds time elapsed
分析:CPU时间占用 63.77ms,上下文切换22次,所以后面切换速率为 22/63.77ms=0.345K/sec
3.2.2. gperftools采集的CPU消耗情况
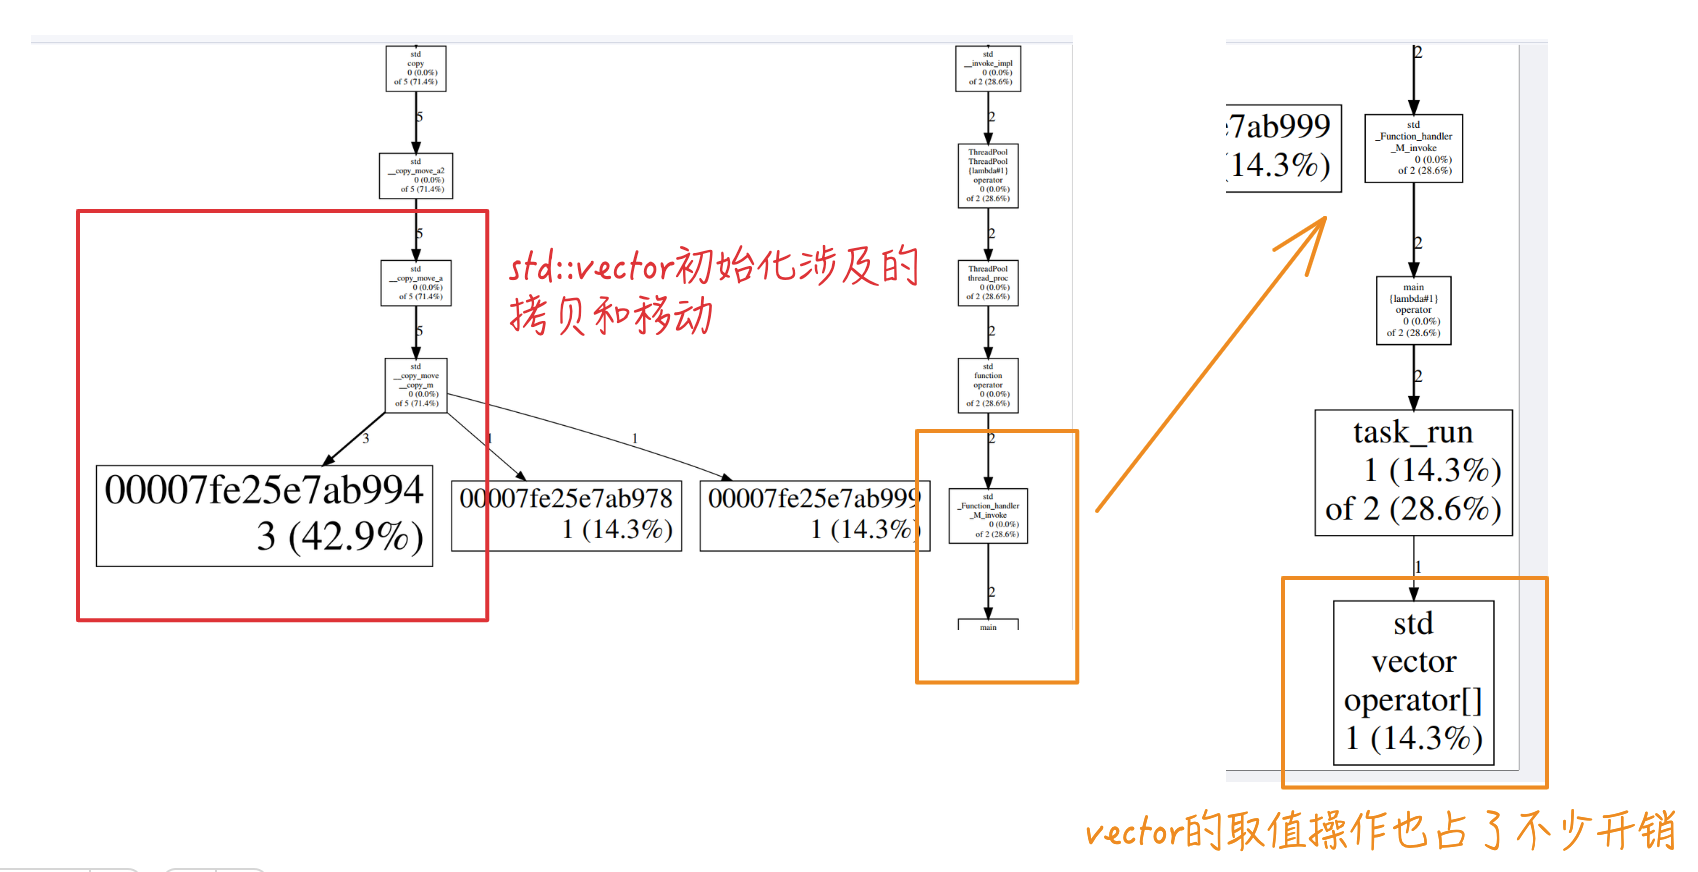
查看 gperftools_report 里面生成的 prof.pdf,可看到最大开销还是vector的数据初始化(std::vector<int> data(10000000, 2);)
线程池中的 任务执行体task_run 中,vector的取值操作也占了不少开销:
1
2
3
4
5
6
7
8
9
10
11
12
13
14
15
16
// 任务执行函数
void task_run(const std::vector<int> &data, int start, int end, Result &result) {
    long long sum = 0;
    for (auto i = start; i < end; i++) {
        sum += data[i];
    }

    lock_guard<mutex> lk(result.mtx);
    result.sum += sum;
    result.task_done_count++;
    printf("start:%d, end:%d, chunk sum:%lld, total:%lld, done count:%d, task:%d\n",
           start, end, sum, result.sum, result.task_done_count, result.task_count);
    if (result.task_done_count == result.task_count) {
        result.cond.notify_one();
    }
}
3.2.3. On-CPU火焰图
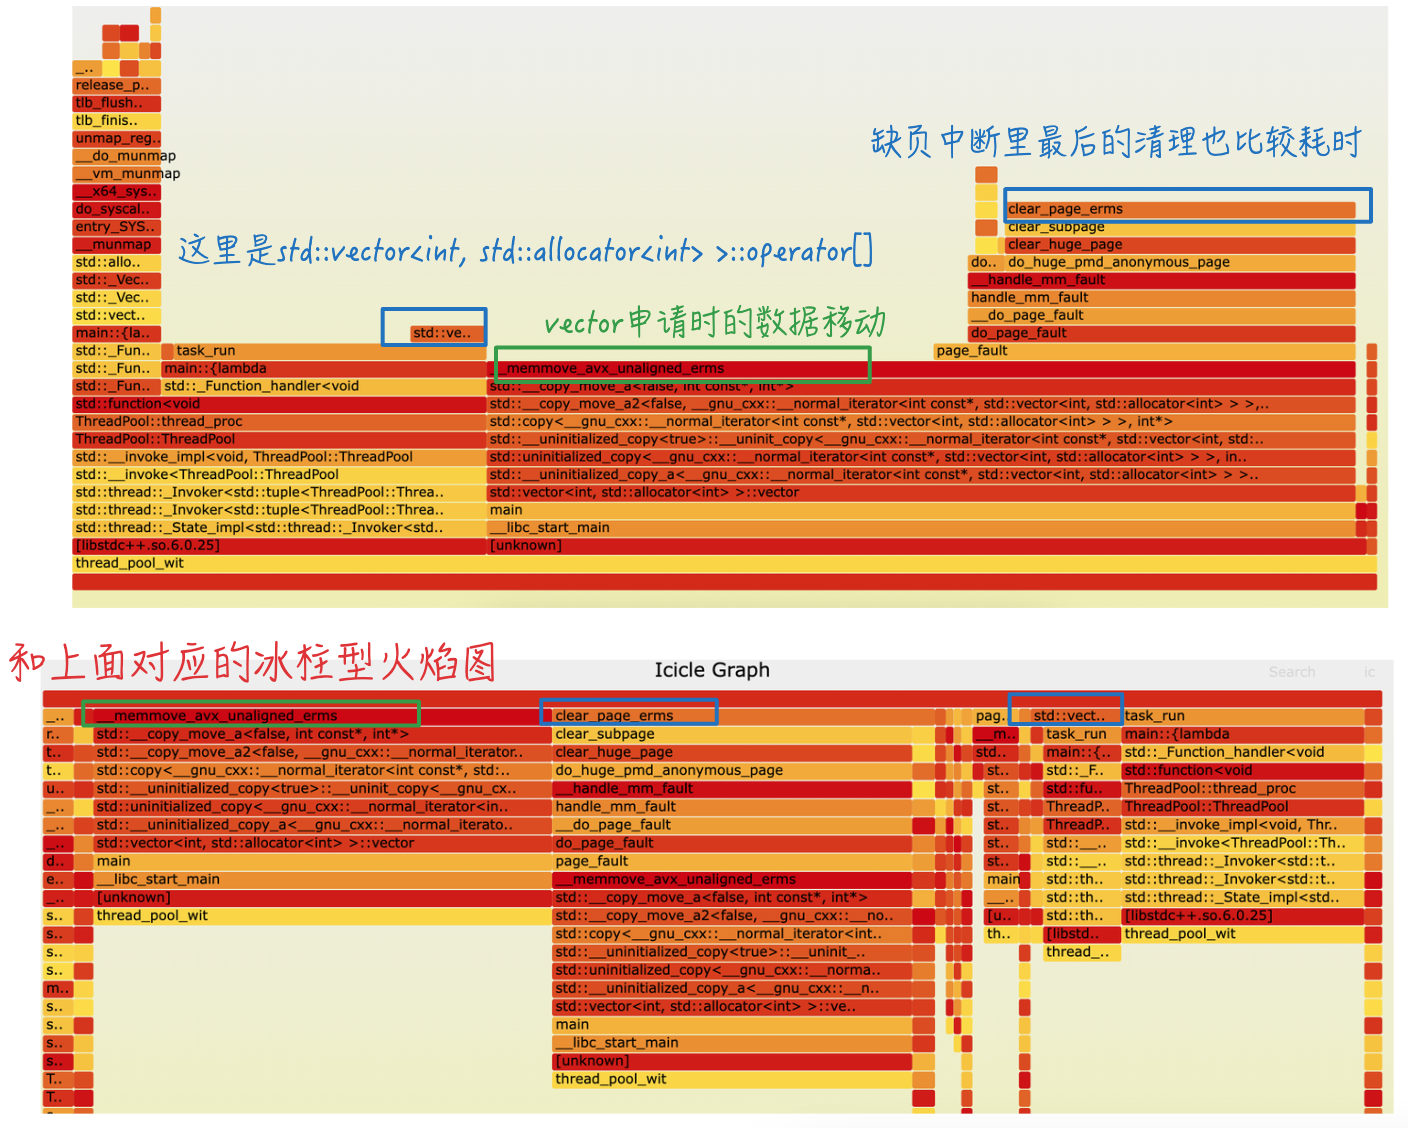
对比看下正常和倒置的冰柱型火焰图,都可以看到比较明显的热点:
- vector申请时的数据移动
- 缺页中断里最后的清理也比较耗时
最左侧的堆栈最高,可以展开看下,可看到是线程池中对应的线程处理回调:ThreadPool::thread_proc
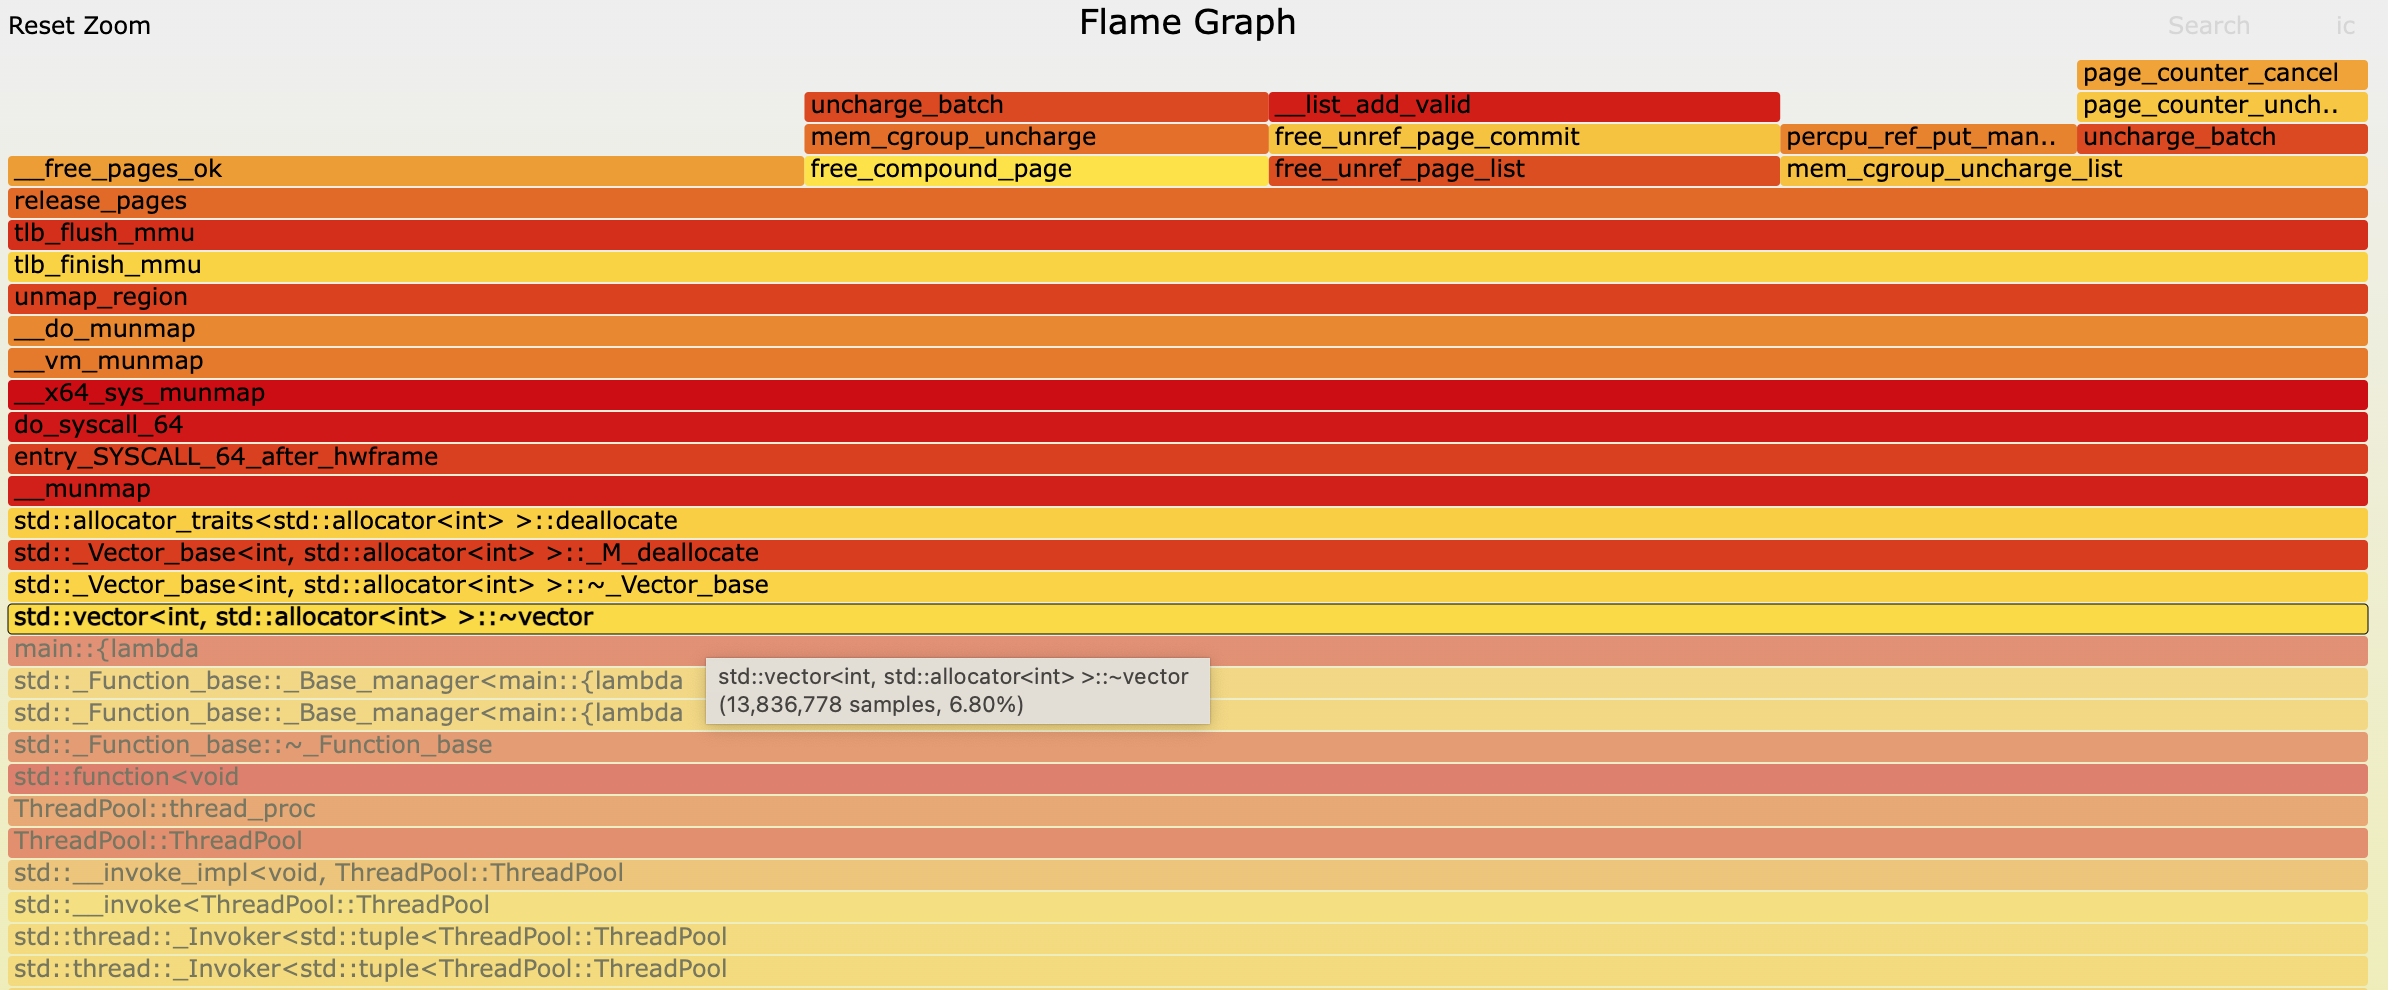
里面主要是std::vector<int, std::allocator<int> >::~vector,vector数据的析构处理,内存映射,tlb、mmu相关的内存调度处理。
对应代码:
1
2
3
4
5
6
7
8
9
10
11
12
13
14
15
16
17
18
19
20
21
22
23
24
25
26
27
28
class ThreadPool {
    ...
    // 构造函数,初始化线程池
    ThreadPool(int num) {
        stop_ = false;
        started_ = false;
        while (num-- > 0) {
            threads.emplace_back([this]() { thread_proc(); });
        }
    }
    ...
    // 线程执行体
    void thread_proc() {
        while (!stop_) {
            std::function<void()> t;
            {
                unique_lock<mutex> lk(task_mtx);
                task_cond.wait(lk, [this]() { return stop_ || (started_ &&!tasks.empty()); });
                if (stop_ && tasks.empty()) {
                    return;
                }
                t = std::move(tasks.front());
                tasks.pop_front();
            }
            t();
        }
    }
};
3.2.4. Wakeup火焰图
生成的wakeup火焰图如下:
- 火焰图里上面是target(即被唤醒者),下面是waker(唤醒者)
- 图中是waker的堆栈,方向是从上到下(和直接eBPF工具抓取的堆栈反了一下,所以上篇容易造成困扰)

3.2.4.1. 调用栈方向问题梳理
调度那块的内核逻辑还没去梳理,对调用栈方向还有些模糊。看wakeup火焰图里面,ttwu_do_wakeup开始看起来跟CPU唤醒有关系,先bpftrace跟踪个堆栈看下。
1
2
3
4
5
6
7
8
9
10
11
12
13
14
15
16
17
18
19
20
21
22
23
24
25
26
27
28
29
30
31
32
33
34
35
36
37
38
39
40
41
# 看了下有现成的插桩点 kprobe:ttwu_do_wakeup
[CentOS-root@xdlinux ➜ tools ]$ bpftrace -l|grep ttwu_do_wakeup
kfunc:ttwu_do_wakeup
kprobe:ttwu_do_wakeup

# 随便找个进程,此处选mysqld,跟踪下堆栈
[CentOS-root@xdlinux ➜ tools ]$ bpftrace -p $(pidof mysqld) -e 'kprobe:ttwu_do_wakeup  { printf("%s, stack:%s\n", comm, kstack); }'
Attaching 1 probe...
swapper/3, stack:
        # 最终被探测的函数,负责实际的唤醒工作,是这次堆栈跟踪的触发点
        ttwu_do_wakeup+1
        # 尝试唤醒一个进程的函数,是唤醒操作的上层逻辑
        try_to_wake_up+422
        # 带有锁机制的唤醒操作函数,确保唤醒过程的线程安全性
        swake_up_locked.part.3+19
        # 唤醒单个进程的函数,在调度器中用于唤醒等待的进程
        swake_up_one+39
        # 与 RCU 报告相关的函数,用于报告 RCU 相关的状态
        rcu_report_qs_rdp+195
        # RCU(Read-Copy-Update)内核机制的核心函数,RCU用于多处理器环境下实现高效的读操作
        rcu_core+102
        # 与软中断相关的函数
        __softirqentry_text_start+215
        # 中断处理完成后退出中断上下文的函数,负责一些清理和状态恢复操作
        irq_exit+247
        # 对称多处理(SMP)环境下的 APIC 定时器中断处理函数
        smp_apic_timer_interrupt+116
        # 处理定时器中断,APIC 用于管理多处理器系统中的中断
        apic_timer_interrupt+15
        # 进一步处理进入特定 CPU 空闲状态的函数
        cpuidle_enter_state+219
        # 进入 CPU 空闲状态的函数
        cpuidle_enter+44
        # 当 CPU 处于空闲状态时执行的函数,用于处理 CPU 空闲时的逻辑
        do_idle+564
        # CPU 启动时进入的入口函数,负责一些初始化相关的工作
        cpu_startup_entry+111
        # 启动辅助 CPU 的相关操作
        start_secondary+411
        # 依次往上调用
        secondary_startup_64_no_verify+194
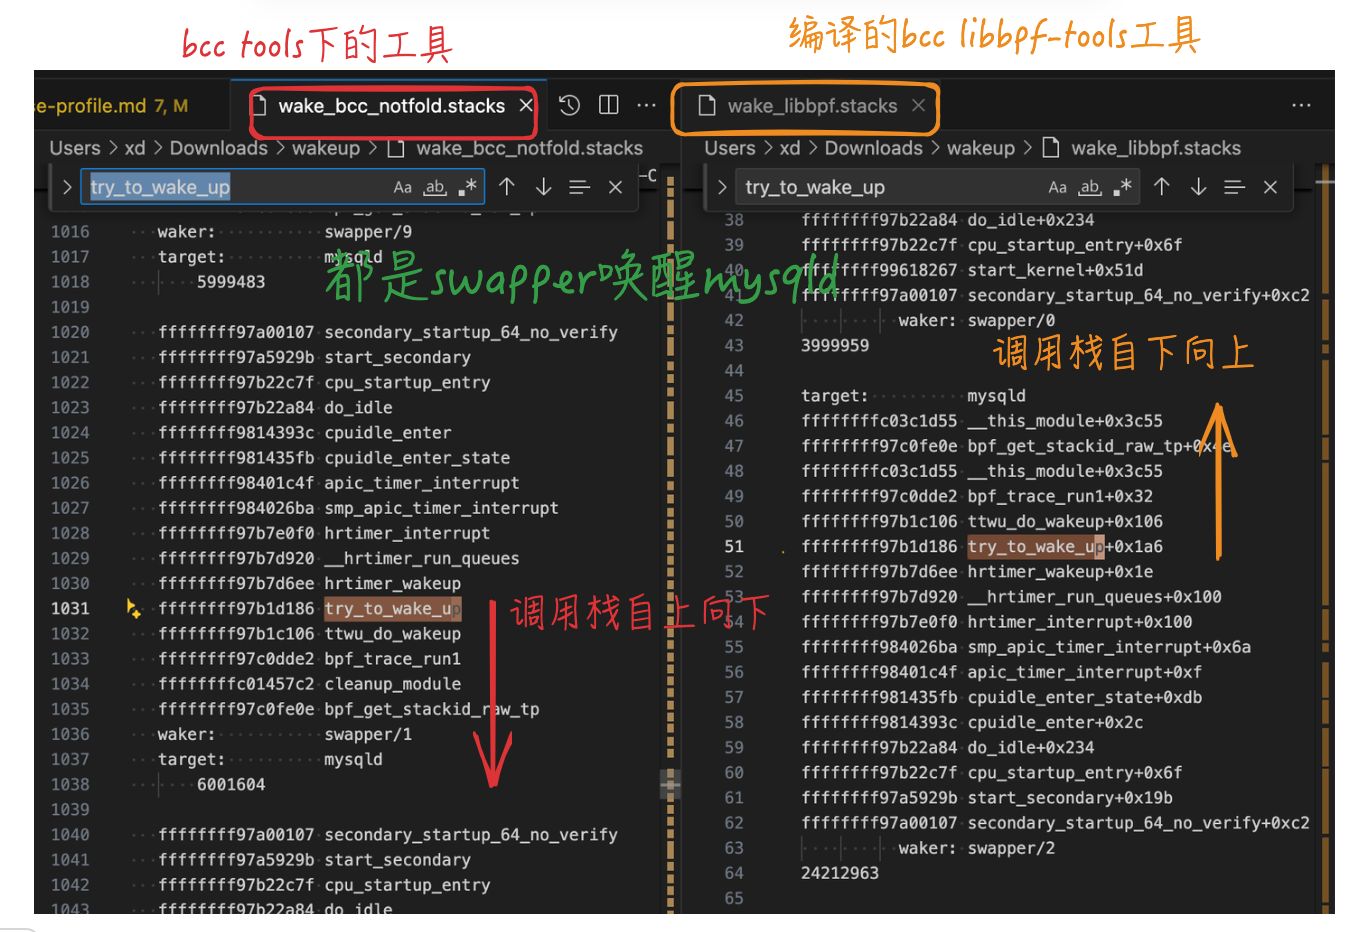
可以看到,eBPF工具直接抓出来的堆栈,是从下往上的,即对应堆栈为:secondary_startup_64_no_verify -> start_secondary -> … -> try_to_wake_up -> ttwu_do_wakeup
贴张对比图就很直观了,eBPF直接采集的堆栈,和bcc tools里面方向不同,bcc tools的python脚本里做了不同处理:
到这里,上篇:并发与异步编程(三) – 性能分析工具:gperftools和火焰图 中的TODO疑问就解决了。
上面采集了ttwu_do_wakeup的堆栈,追踪到了调用该函数之前的调用关系,若还想看ttwu_do_wakeup中进行了什么调用,可使用ftrace跟踪,使用perf-tools中的funcgraph工具:
1
2
3
4
5
6
7
8
9
10
11
12
13
14
15
16
17
18
19
20
21
22
23
24
25
26
27
28
29
30
31
32
33
34
[CentOS-root@xdlinux ➜ bin git:(main) ]$ ./funcgraph -p $(pidof mysqld) -H ttwu_do_wakeup
Tracing "ttwu_do_wakeup" for PID 1308... Ctrl-C to end.
# tracer: function_graph
#
# CPU  DURATION                  FUNCTION CALLS
# |     |   |                     |   |   |   |
  4)               |  ttwu_do_wakeup() {
  8)               |  ttwu_do_wakeup() {
  8)               |    check_preempt_curr() {
  8)               |      check_preempt_wakeup() {
  8)   0.060 us    |        update_curr();
  4)               |    check_preempt_curr() {
  8)   0.041 us    |        wakeup_preempt_entity.isra.72();
  4)               |      check_preempt_wakeup() {
  8)   1.192 us    |      }
  4)   0.060 us    |        update_curr();
  8)   1.613 us    |    }
  4)   0.030 us    |        wakeup_preempt_entity.isra.72();
  4)   0.811 us    |      }
  4)   1.163 us    |    }
  8)   3.537 us    |  }
  4)   2.254 us    |  }
  4)               |  ttwu_do_wakeup() {
  4)               |    check_preempt_curr() {
  4)               |      resched_curr() {
  4)               |        native_smp_send_reschedule() {
  4)               |          default_send_IPI_single_phys() {
  4)   0.050 us    |            __default_send_IPI_dest_field();
  4)   0.791 us    |          }
  4)   1.042 us    |        }
  4)   1.342 us    |      }
  4)   1.603 us    |    }
  4)   1.894 us    |  }
  ...
3.2.5. offwaketime火焰图

分析:
- 唤醒者(顶部)和被唤醒者(底部)堆栈差不多,因为主要是线程池中的线程间轮换。
- 被唤醒者(target)进入阻塞等待的原因,是因为等锁:
futex_wait_queue_me- mutex一般基于
futex(Fast Userspace Mutex,快速用户空间互斥锁)实现
- mutex一般基于
- 唤醒者(waker),通过
futex_wake->wake_up_q进行唤醒
4. std::async
前面也简单介绍std::async了,async的返回值是一个未来对象:std::future<V>。
std::future代表异步操作结果,有3种获取状态的方式:get、wait、wait_for- 状态为
std::future_status,枚举值有std::future_status::ready、timeout、deferred
- 状态为
std::promise用于在某一线程中设置某个值或异常,std::future则用于在另一线程中获取这个值或异常std::promise<int> prom;,promise中使用get_future获取future:auto fut = prom.get_future();,- 使用promise时要注意一点,如果promise被释放了,而其他的线程还未使用与promise关联的future,当其使用这个future时会报错
std::packaged_task包装了一个可调用的任务,可以存储在std::future中- 其
get_future()方法返回一个和任务关联的std::future对象 - 调用std::packaged_task对象的
operator(),可以开始执行任务 - 对比:std::promise包装的是一个值,std::packaged_task包装的是一个可调用对象
- 其
异步改造,完整代码见:GitHub链接。主要是任务入队时,std::packaged_task将其包装成异步任务,并通过其std::future用来获取结果:
1
2
3
4
5
6
7
8
9
10
11
12
13
14
15
16
17
18
19
20
21
22
23
24
25
26
27
28
29
class ThreadPool {
    ...
    // 将任务加入线程池,并返回一个 std::future 对象用于获取任务结果
    template <class F, class... Args>
    auto enqueue_task(F&& f, Args&&... args)
        -> std::future<typename std::result_of<F(Args...)>::type> {
        using return_type = typename std::result_of<F(Args...)>::type;

        // std::packaged_task 包装一个可调用对象
        // 将一个可调用对象包装成一个异步任务,并提供一个 std::future 对象来获取任务的返回值。
        auto task = std::make_shared< std::packaged_task<return_type()> >(
            // std::bind 将任务函数和参数绑定在一起,
            // 然后将封装好的 std::packaged_task 包装成一个无参数的 std::function<void()> 并加入任务队列
            std::bind(std::forward<F>(f), std::forward<Args>(args)...)
        );

        // 返回std::packaged_task的 std::future对象,调用者可以通过该对象异步地获取任务的执行结果
        std::future<return_type> res = task->get_future();
        {
            unique_lock<mutex> lk(task_mtx);
            if (stop_)
                throw std::runtime_error("enqueue on stopped ThreadPool");
            tasks.emplace_back([task]() { (*task)(); });
        }
        task_cond.notify_one();
        return res;
    }
    ...
};
入队调用和结果处理:
1
2
3
4
5
6
7
8
9
10
11
12
13
14
15
16
17
int main(int argc, char *argv[]) {
    ...
    // 存储所有任务的 future 对象
    std::vector<std::future<long long>> futures;
    // 信号触发后开始逻辑
    for (std::vector<int>::size_type i = 0; i < data.size(); i += chunk) {
        int end = std::min(i + chunk, data.size());
        // 将任务加入线程池并获取 future 对象
        futures.emplace_back(pool.enqueue_task(task_run, std::ref(data), i, end));
    }
    // 等待所有任务完成并累加结果
    for (auto& future : futures) {
        total_sum += future.get();
    }
    // 输出最终结果
    cout << "result: " << total_sum << endl;
}
4.1. 结果
结果文件可见:std_async/results
简单贴一下。
4.1.1. perf stat结果
由于只跑了一次,下面结果仅作参考。比较明显的是page-faults缺页中断触发少很多。
1
2
3
4
5
6
7
8
9
10
11
12
13
14
15
 Performance counter stats for process id '75661':

             21.21 msec task-clock                #    0.003 CPUs utilized
                18      context-switches          #    0.849 K/sec
                 1      cpu-migrations            #    0.047 K/sec
                35      page-faults               #    0.002 M/sec
        84,273,658      cycles                    #    3.973 GHz                      (47.25%)
           476,389      stalled-cycles-frontend   #    0.57% frontend cycles idle     (49.56%)
         1,167,560      stalled-cycles-backend    #    1.39% backend cycles idle      (72.10%)
       255,376,401      instructions              #    3.03  insn per cycle
                                                  #    0.00  stalled cycles per insn  (89.48%)
        41,081,130      branches                  # 1936.921 M/sec                    (98.48%)
            22,809      branch-misses             #    0.06% of all branches          (82.16%)

       8.010221802 seconds time elapsed
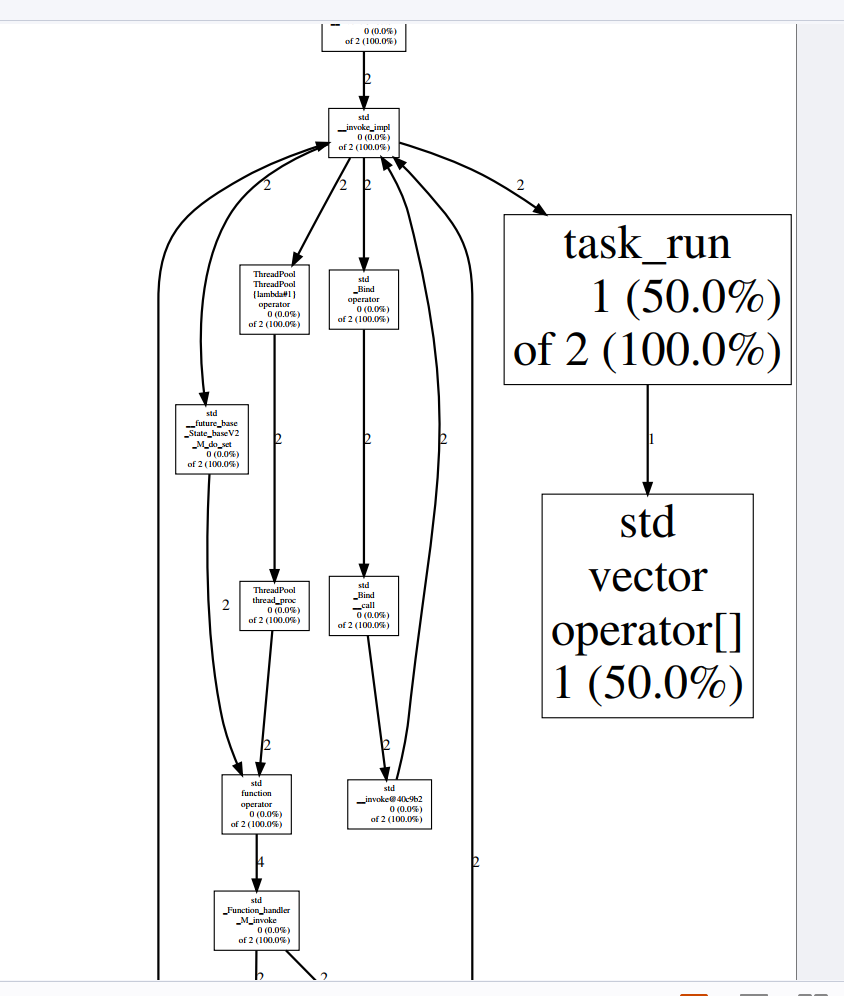
4.1.2. gperftools结果
样本只采集到2个,貌似参考性不大:
4.1.3. 火焰图
On-CPU火焰图:

wakeup:差别不大

offwaketime:差别不大

5. io_uring(不完全)
io_uring需要内核 >= 5.1,自己本地只有4.18,用不了。
起一个阿里云ECS,内核版本:5.10.134
1
2
[root@iZ2ze0gmmk36e8oc4ff2woZ std_async]# uname -a
Linux iZ2ze0gmmk36e8oc4ff2woZ 5.10.134-18.al8.x86_64 #1 SMP Fri Dec 13 16:56:53 CST 2024 x86_64 x86_64 x86_64 GNU/Linux
下载编译:liburing,并试用examples下的bin程序。有些程序要求更高的版本如6.1,暂时先只看io_uring-cp了。。。(手动修改io_uring-cp.c,添加一个回车后才继续的逻辑,便于根据进程号采集)
1
2
3
4
5
6
7
8
# liburing/examples
...
-rwxr-xr-x 1 root root   72K Mar 16 22:49 io_uring-close-test
-rwxr-xr-x 1 root root   80K Mar 16 22:49 link-cp
-rwxr-xr-x 1 root root   89K Mar 16 22:49 io_uring-udp
-rwxr-xr-x 1 root root  106K Mar 16 22:49 send-zerocopy
-rwxr-xr-x 1 root root   95K Mar 16 22:49 ucontext-cp
-rwxr-xr-x 1 root root   88K Mar 16 22:54 io_uring-cp
有点费劲,只收集到部分数据。
wakeup火焰图:

offwaketime火焰图:

6. 小结
进行demo实验,并使用 gperftools 和 火焰图 进行性能采集和简单分析。